Monitoring Tezos consensus health — without the protocol-upgrade treadmill
An open-source consensus exporter for Octez that generates its RPC types from the node’s own schema, so it keeps working across protocol upgrades.
Operators of Octez nodes — bakers, infrastructure teams, teztnet maintainers — generally need the same view: consensus health from a node’s vantage point. How fast quorum forms, the reception delay on attestations, whether a given delegate is missing slots, whether DAL data is being attested.
A recurring difficulty in building that view is that consensus RPC shapes change at protocol
boundaries. A monitoring tool that hard-codes those shapes requires a rebuild — often against
the tezos/tezos monorepo — whenever a new protocol reshapes an operation. Two recent examples:
Seoul introduced BLS
aggregate attestations
(attestations_aggregate) as a new operation kind, and Tallinn split the consensus-power
field into slots + baking_power. Either change breaks a parser that assumes the old shape.
This post describes octez-consensus-exporter, an open-source tool that avoids that
treadmill. It currently runs across the public teztnets.
Repository (public): gitlab.com/tezos-infra/octez-consensus-exporter
Approach: derive the types from the node’s own schema
Octez exposes a self-describing RPC interface. For any endpoint,
GET /describe/<rpc-path>?recurse=true
returns a JSON Schema of that RPC’s output at .static.get_service.output.json_schema.
That schema is derived from the protocol’s own
data-encoding, so it is an accurate
description of the currently-active protocol.
Rather than hand-writing the wire types (or generating and linking them from OCaml), the
exporter generates them from the node’s live schema — via quicktype
— for the handful of RPCs it consumes (block header, block operations, attestation and baking
rights, the mempool monitor). A thin adapter maps those generated types onto a small set of
stable domain types that the rest of the code depends on. Protocol-specific quirks — such as
the attestation / attestation_with_dal / attestations_aggregate union — are confined to
that adapter.
Consequently, a protocol upgrade is handled by re-running codegen rather than rebuilding. A CI drift-gate regenerates the types against a live node and fails on any diff, so an RPC-shape change surfaces as a failed pipeline rather than as silently wrong data.
The exporter is a plain Go HTTP client of the node: no protocol plugin, no monorepo build, no chain writes.
What it measures — the consensus lifecycle
The exporter follows a block’s path to consensus and times each stage relative to the block’s slot, mirroring Tenderbake:
Block proposed → Preattestations → Attestations → 66% quorum → Applied
The main Report dashboard puts the aggregate picture on one screen: attestation rate, validation/application delay, round distribution, and a canvas of the lifecycle timed against the block slot.
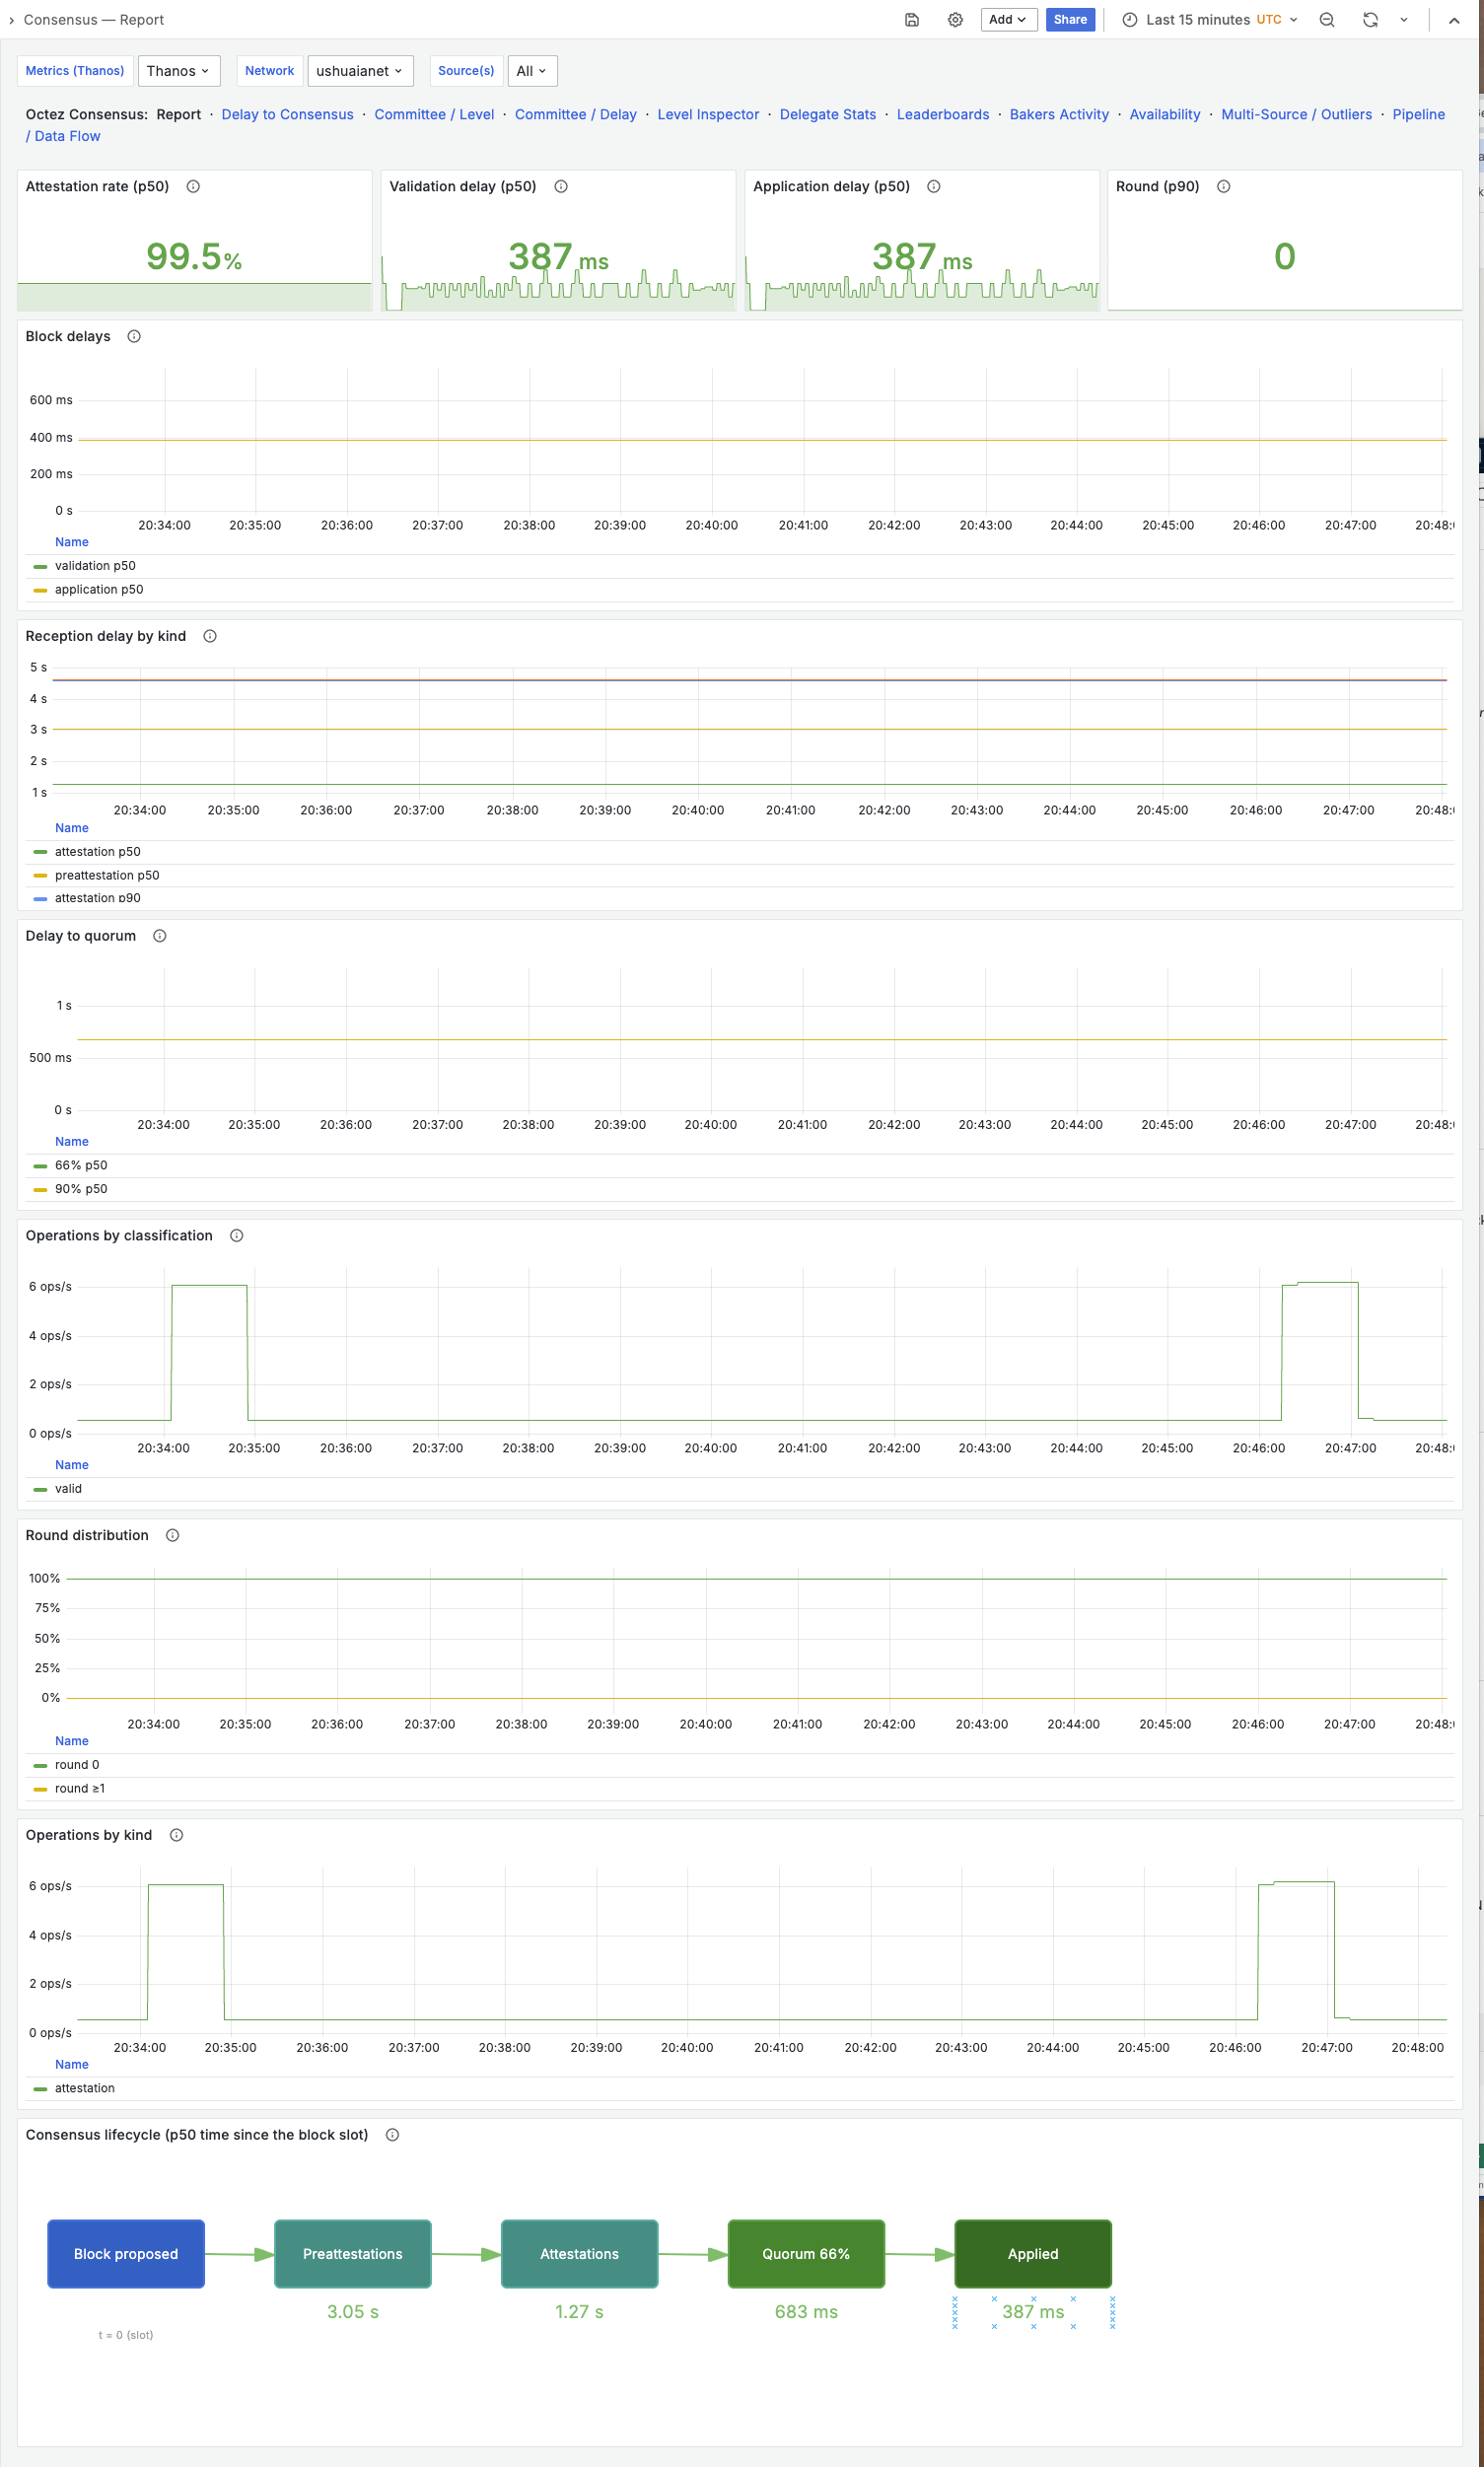 The Report dashboard. All screenshots here are from the project’s fixture-driven demo stack, so
every address is a synthetic
The Report dashboard. All screenshots here are from the project’s fixture-driven demo stack, so
every address is a synthetic tz…FAKEBAKER… placeholder.
Per network and vantage point, it exposes:
- Attestation rate — the fraction of attesting power that attested each block.
- Reception delay by kind — how late the node observed attestations / preattestations relative to the block’s slot time.
- Delay to quorum — time until 66% / 90% of attesting power was received; the primary measure of how fast consensus converges.
- Block validation and application delay, and the round of the canonical block.
- DAL slot coverage — the number of
Data Availability Layer slots
each attestation marks available (the pop-count of its
dal_attestationbitfield). - Missed attestations / blocks, and held operations (branch-delayed in the mempool).
Per-delegate detail is retained but bounded: per-delegate series exist only for a rolling watchlist of the most-recently-active delegates plus a fixed set, which keeps cardinality bounded even with mainnet’s hundreds of bakers. Because a block corresponds to a single point in time, the block level is used as the time axis, never as a label.
The per-delegate view surfaces reception delay, deviation from the network’s median, and which delegates missed attestations:
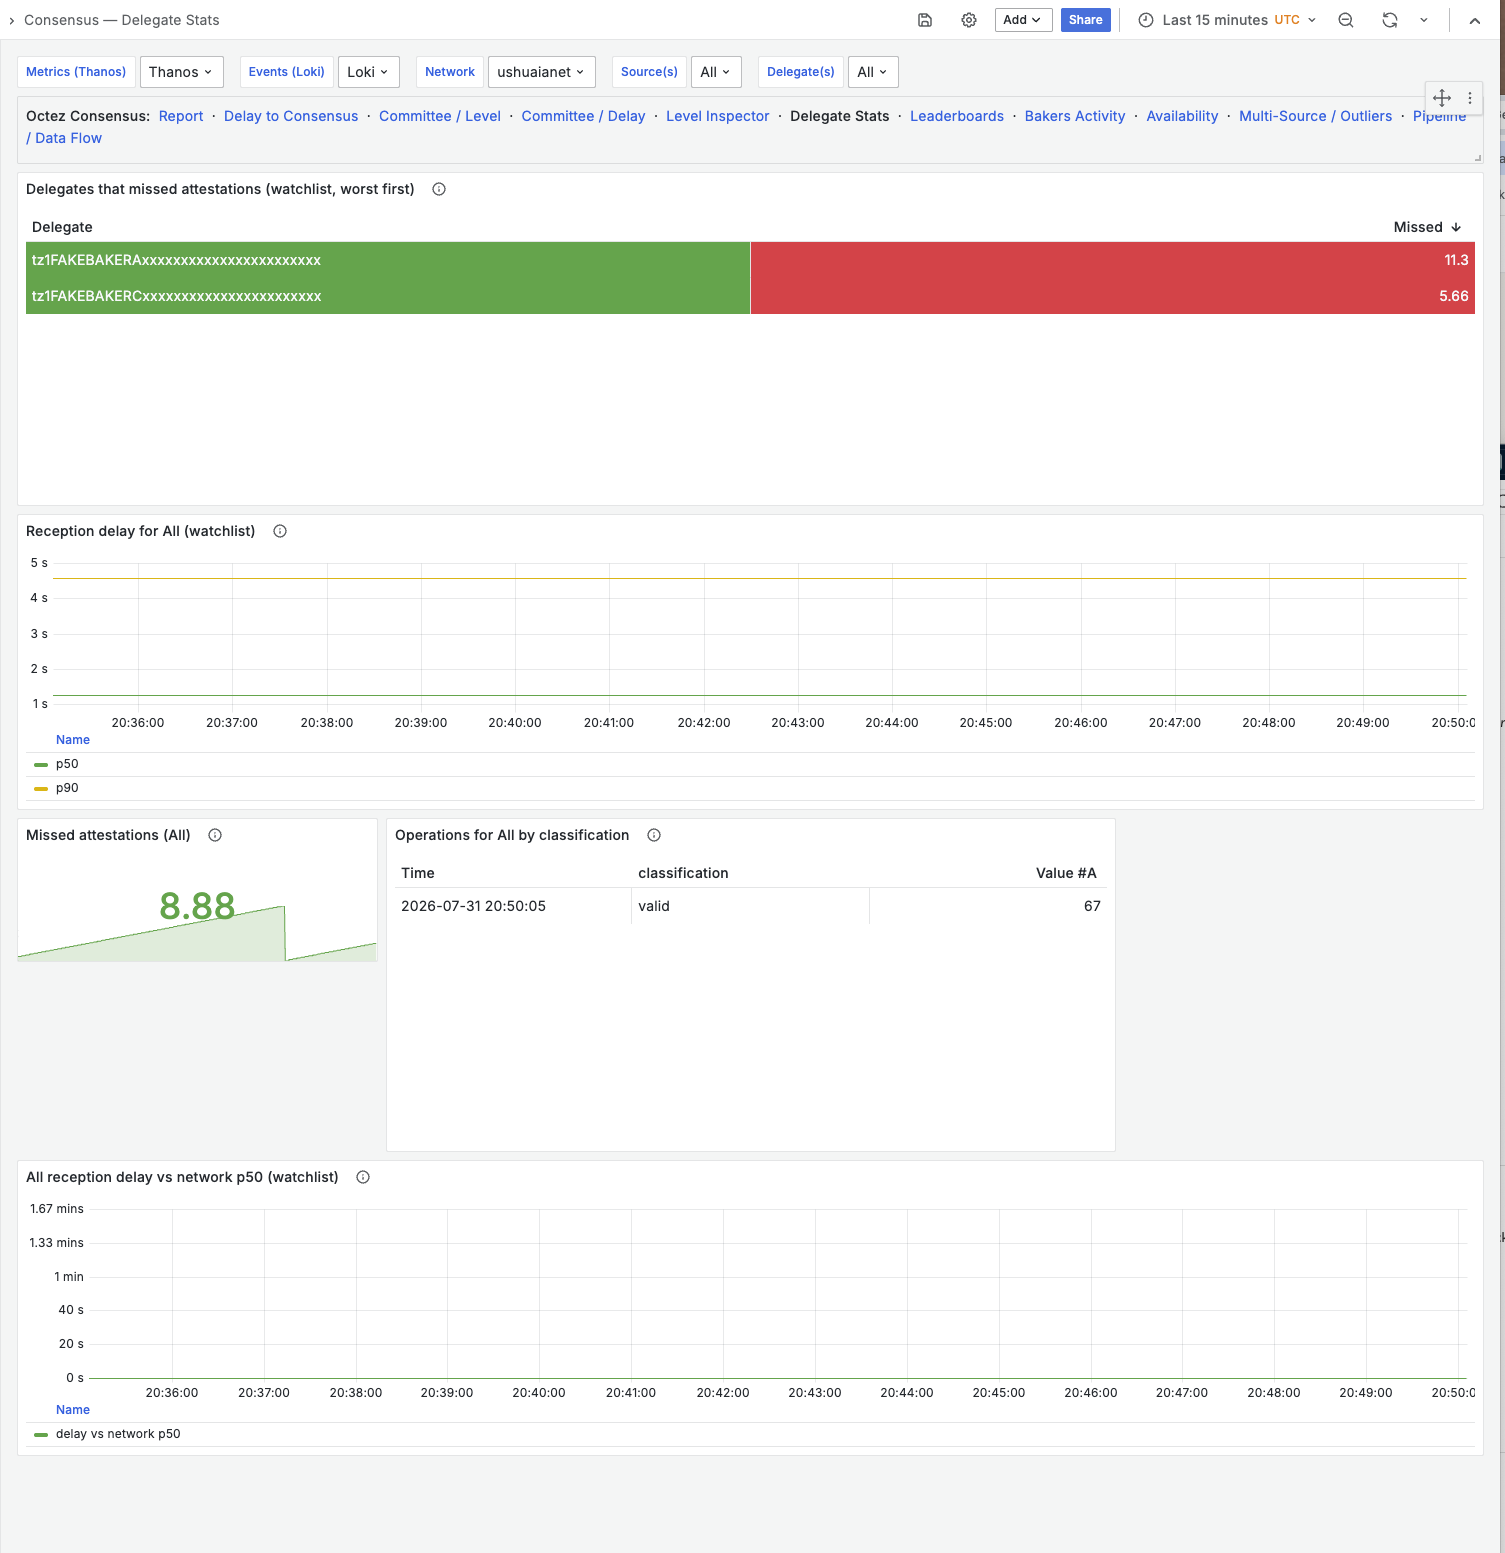 Delegate Stats — deviation from the network median and a “who missed attestations” watchlist.
Architecture — fleet-native, no bundled storage
The design feeds an existing observability stack rather than shipping a separate service, database and UI.
- Aggregate signals → Prometheus / Thanos — histograms and counters for trends, SLOs and alerts.
- Exact per-event records → Loki — one structured JSON line per consensus event
(
block,attestation,preattestation,missing_block), allowing a drill-down from a trend to the exact delegate, block hash and millisecond delay. These are the exporter’s own synthesized events, not the node’s process logs. - Dashboards → Grafana, compiled from grafonnet in CI, including a consensus-lifecycle flow view and cross-vantage outlier boards.
- Alerting → Alertmanager, via a shipped
PrometheusRule(low attestation rate, high delay-to-quorum, exporter down / lagging, missed attestations / blocks).
The exporter taps two node monitor streams at full fidelity — /monitor/heads/main and
/chains/main/mempool/monitor_operations — plus a few polled helpers (header, operations,
attestation / baking rights). Because histogram buckets accumulate between scrapes, a 15-second
scrape interval loses no precision on the aggregate distributions.
The exporter even watches its own pipeline — a self-observability dashboard shows the node → exporter → Thanos/Loki flow, the event rate, and the Loki throughput / retention footprint:
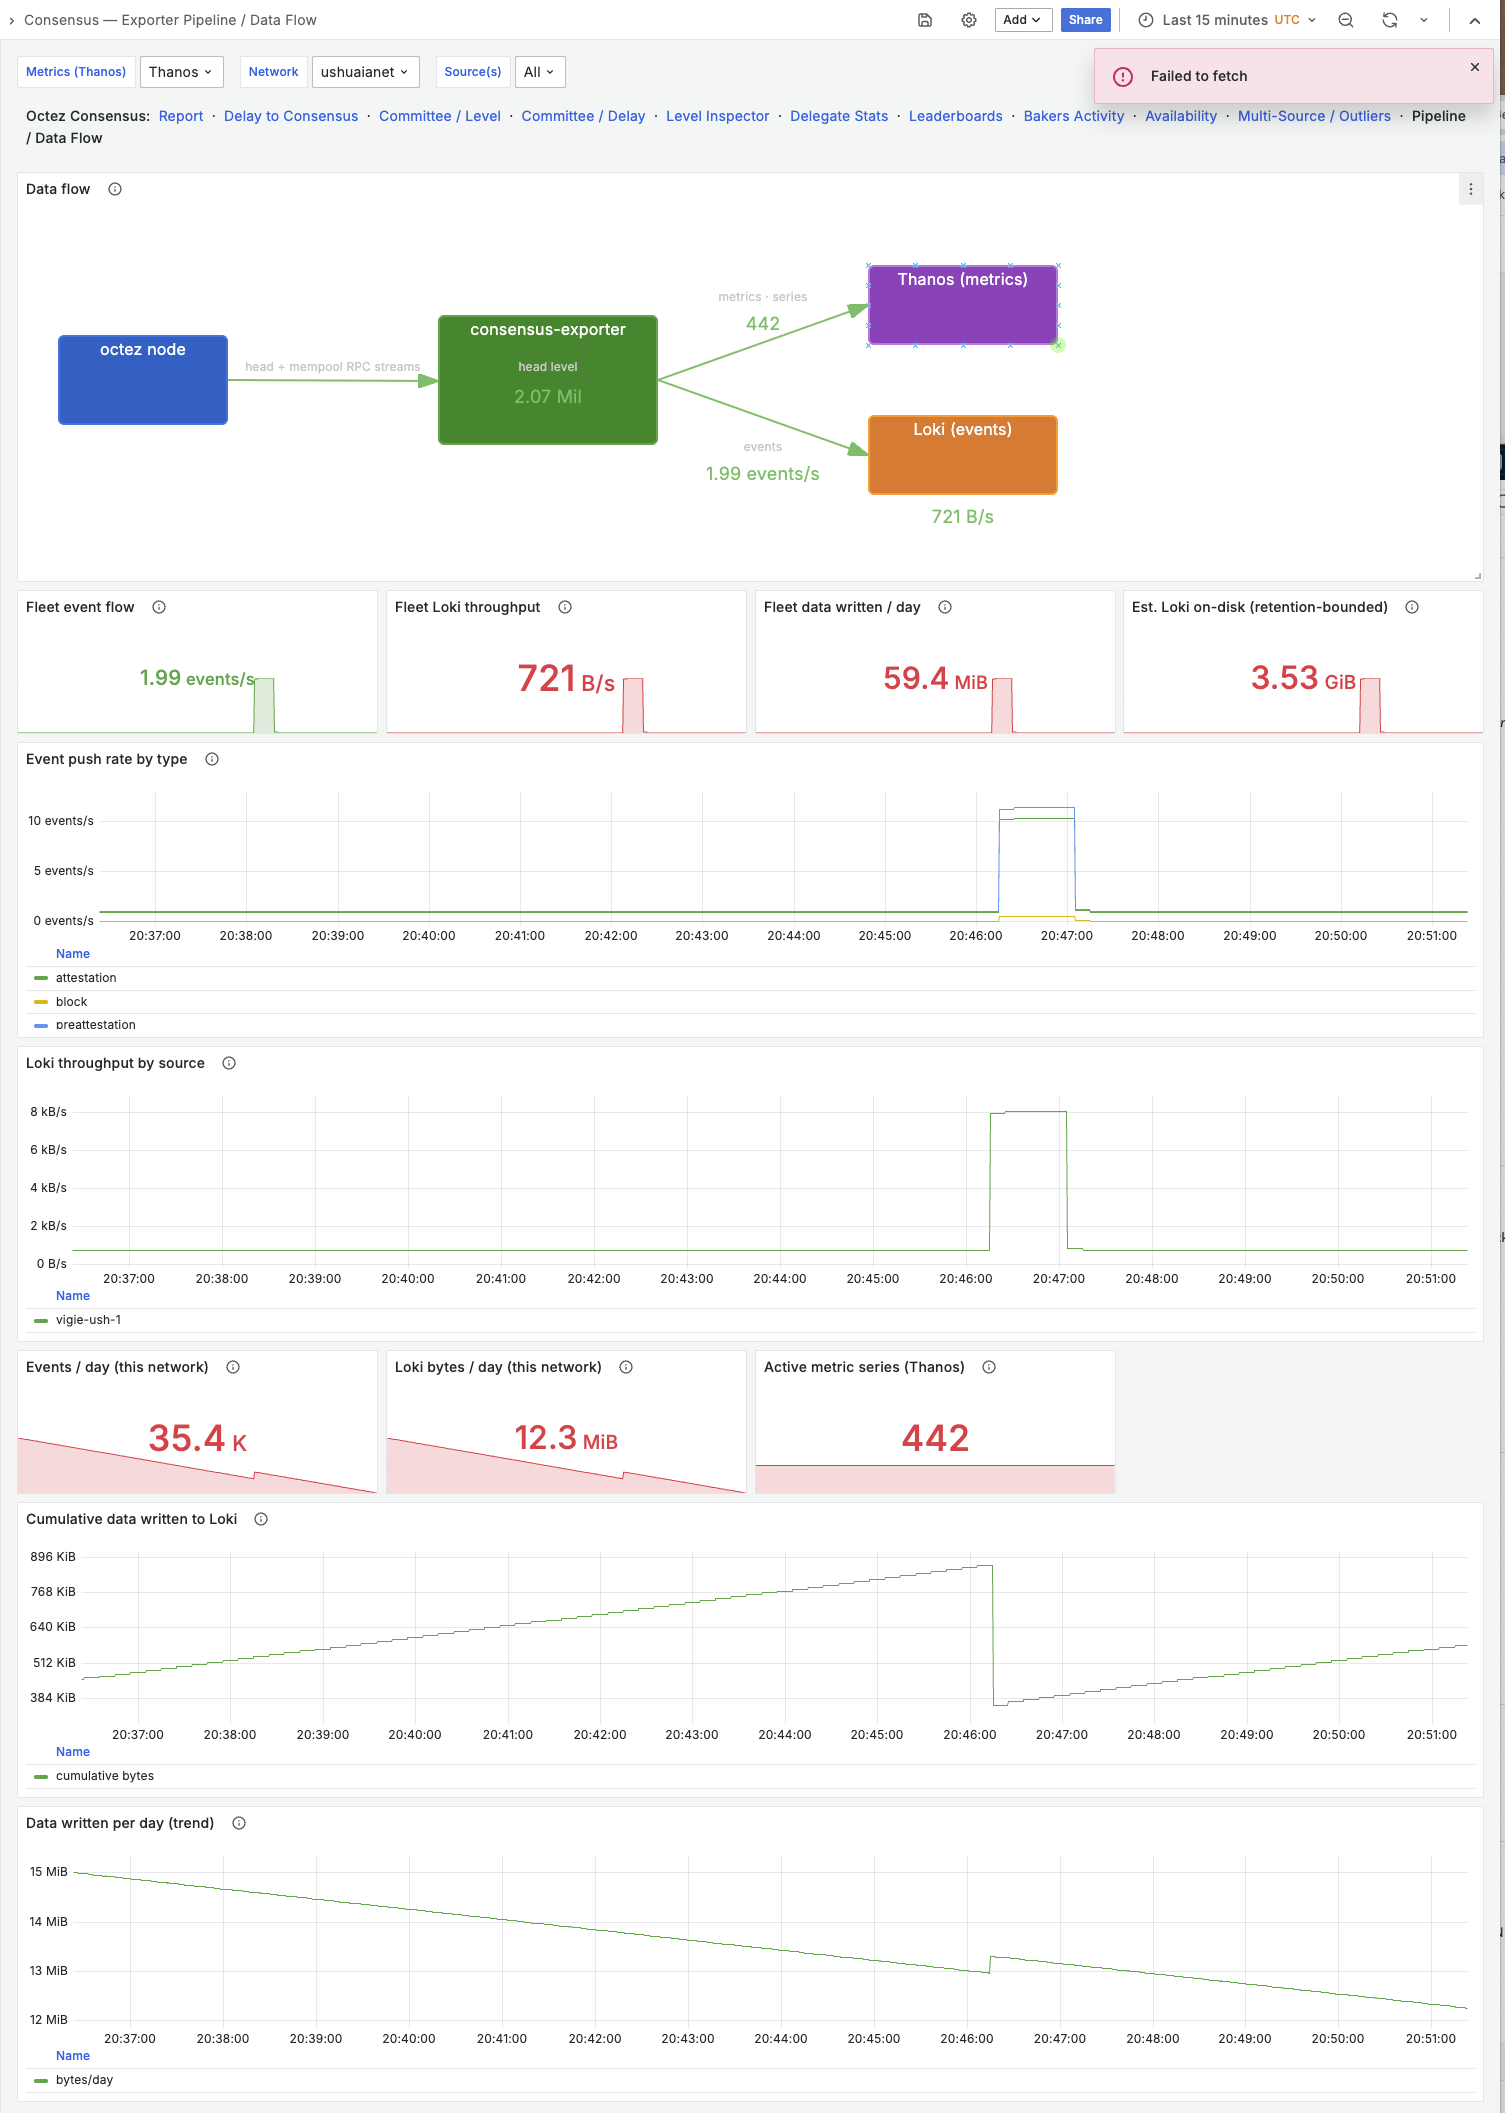 The exporter’s own data-flow / self-observability dashboard.
Because every event lands in Loki as structured JSON, any aggregate trend drills down to the exact per-operation detail for a single block level:
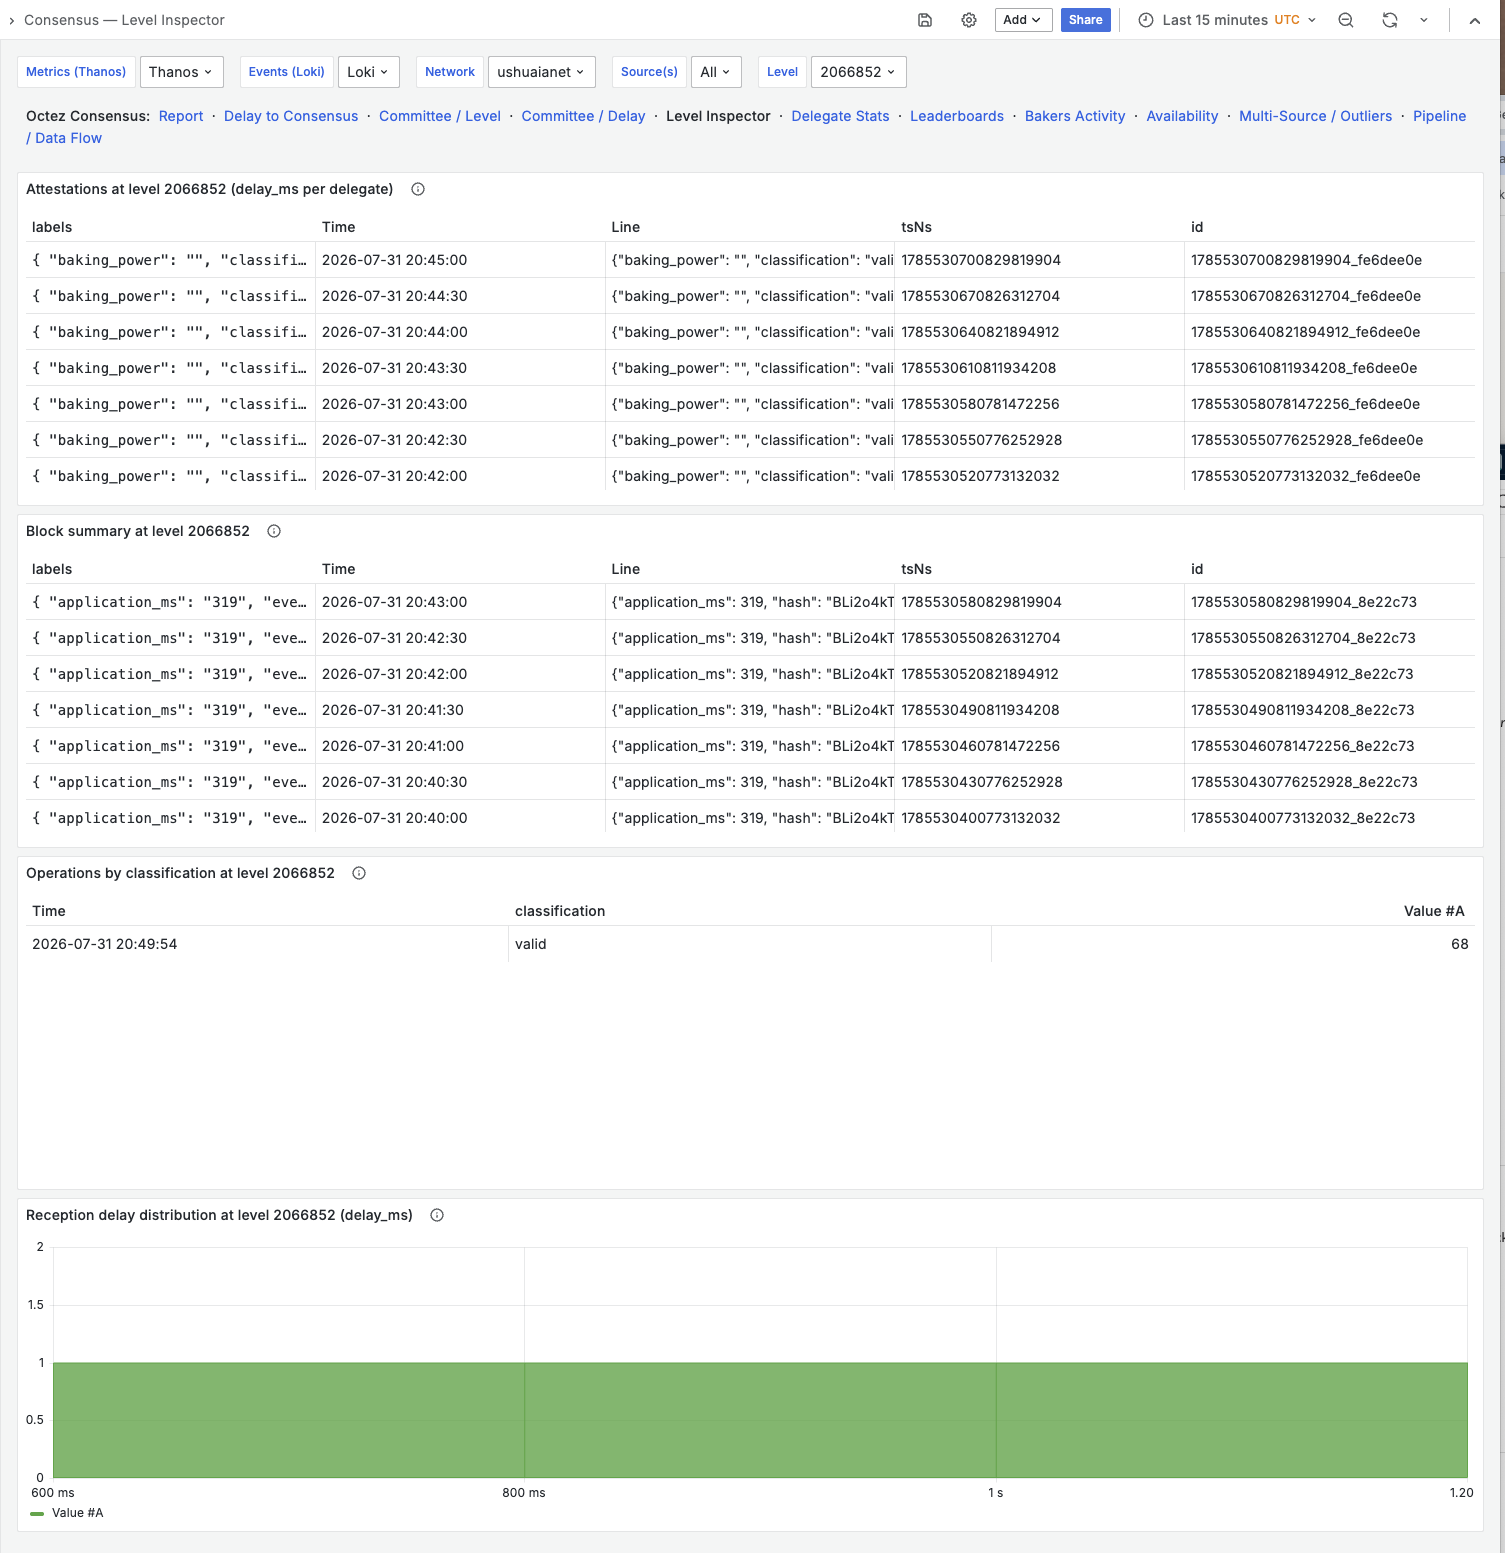 Level Inspector — the exact attestations, block summary and delay distribution for one level.
Deployment — GitOps, driven by the teztnet list
The exporter runs on Kubernetes via a Helm chart, reconciled by Argo CD. An ApplicationSet reads teztnets.com/teztnets.json and generates one node + exporter per public network automatically — mainnet plus each active teztnet. A new testnet is picked up on the next reconcile; weeklynet’s weekly genesis reset is handled with dated application names, so each rotation is a fresh deployment. Nodes bootstrap from snapshots with a self-healing head-progress probe, so the fleet comes up without manual intervention.
At the time of writing it monitors mainnet, ushuaianet, shadownet and bakingnet, with DAL coverage observed on all of them.
Use cases
- Bakers — reception delays and misses for specific delegates, from an independent vantage point.
- Teztnet and infrastructure operators — consensus SLOs and alerts for an entire fleet, within an existing Grafana deployment.
- Protocol and tooling authors — a reusable pattern: driving wire types from the node’s
/describeschema, for any tool that must survive Tezos protocol upgrades.
Leaderboards make the fleet-wide “who’s fastest / slowest / missing” view immediate:
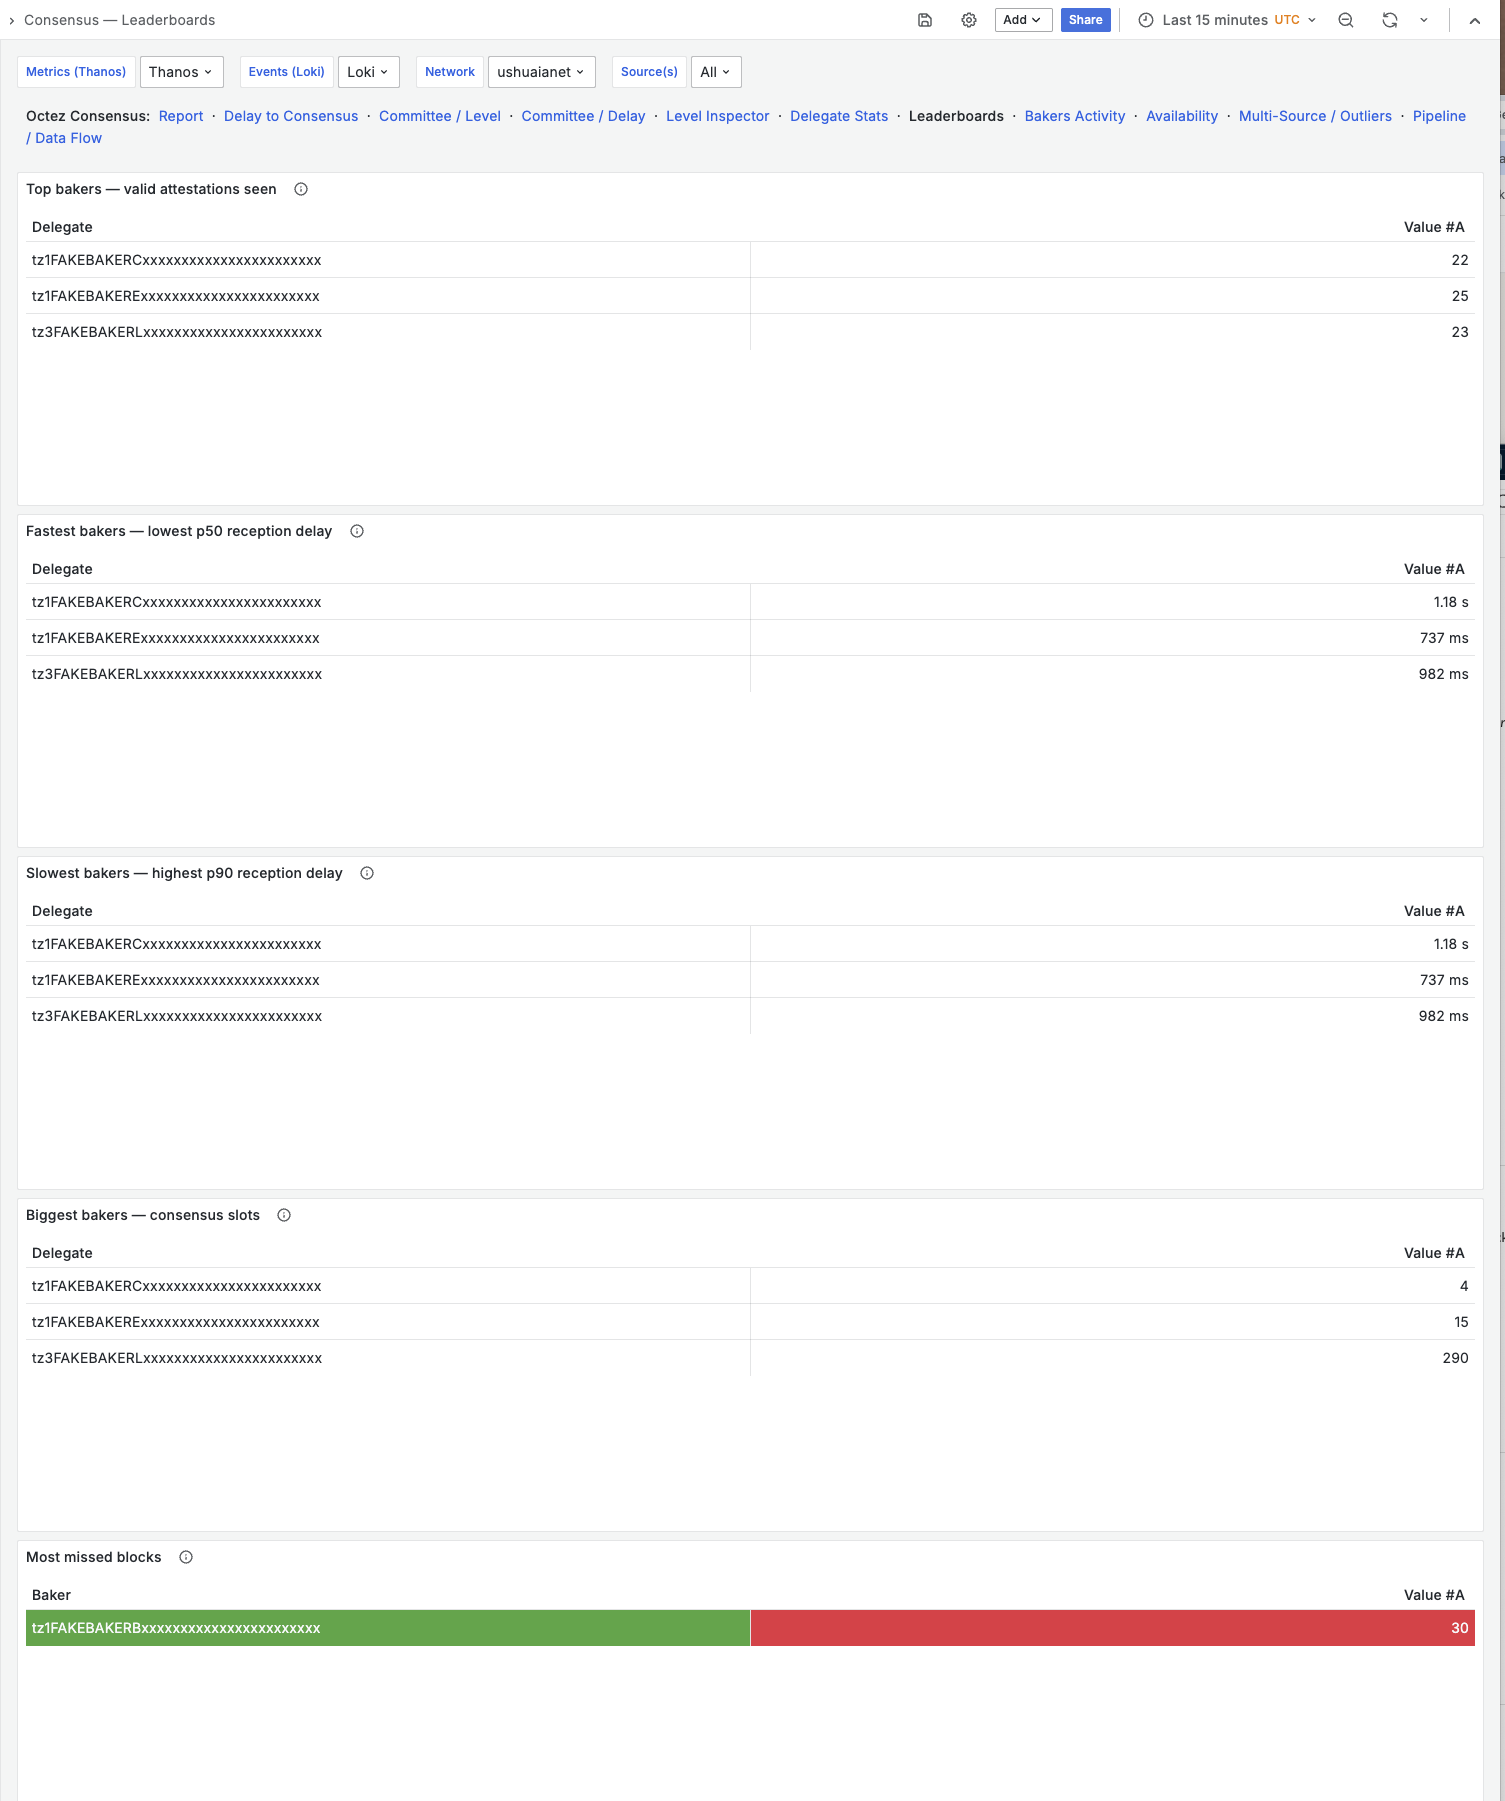 Leaderboards — top / fastest / slowest / biggest bakers, and most missed blocks.
More dashboards
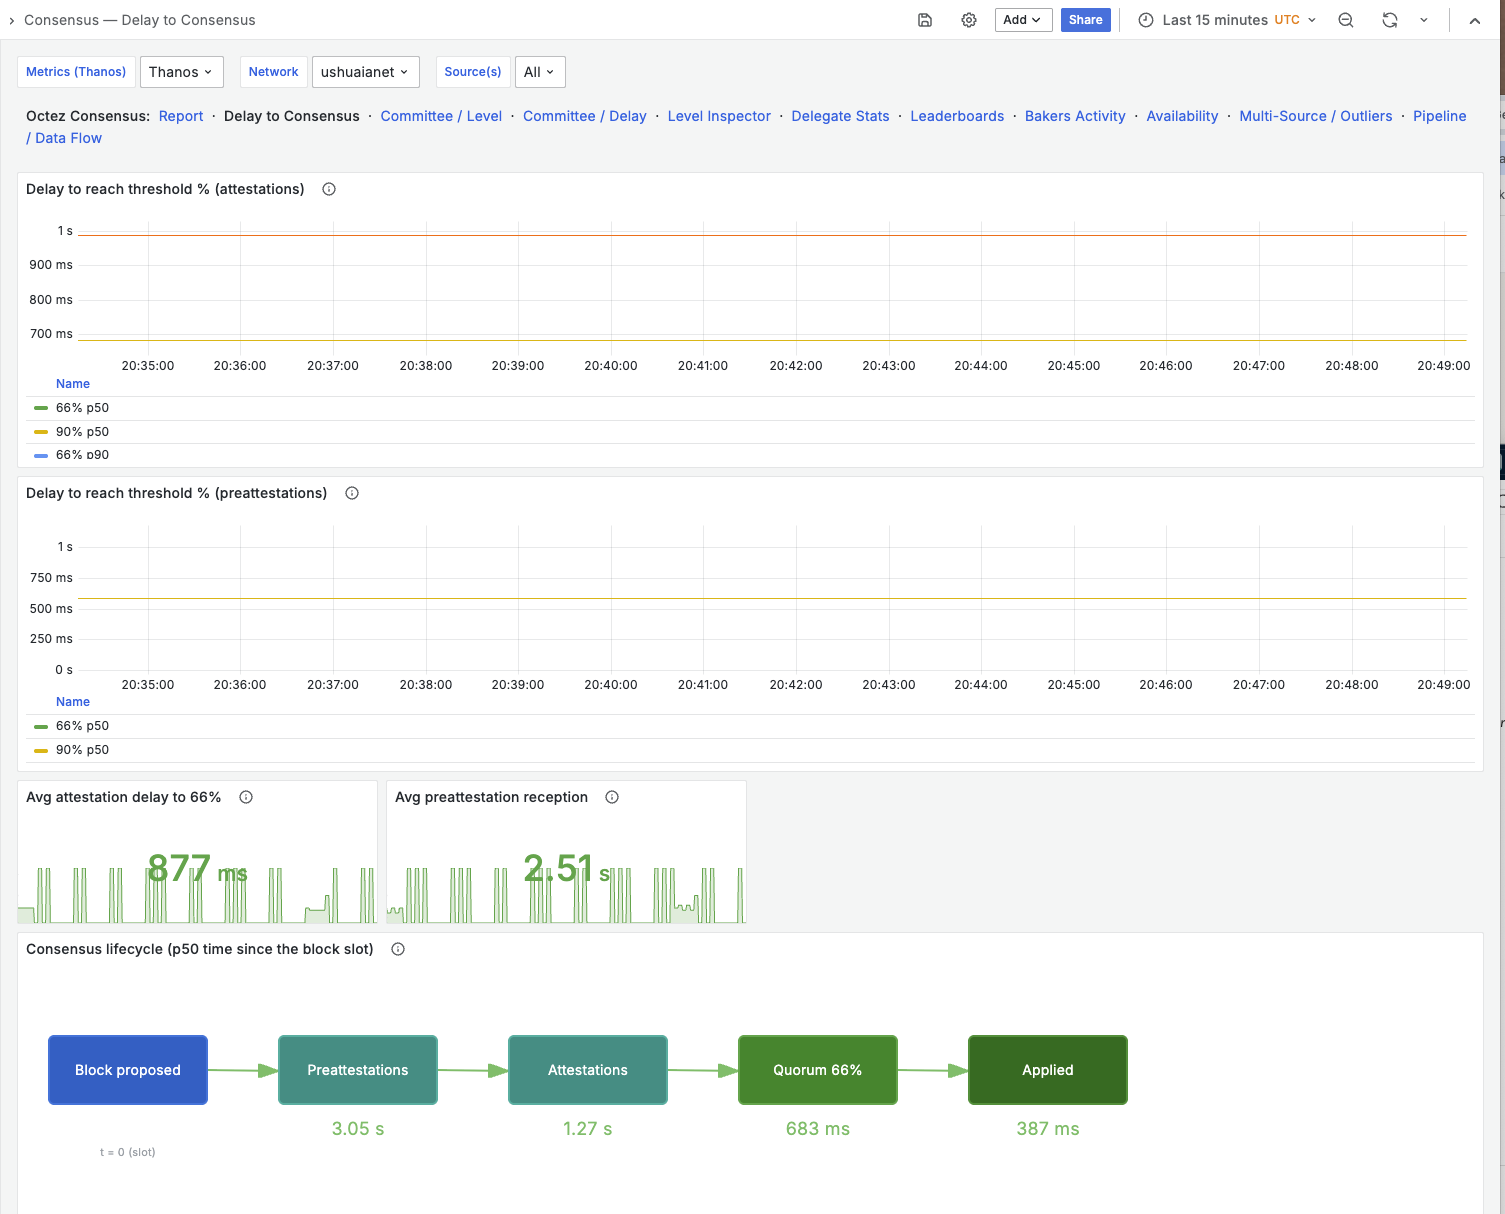 *Delay to Consensus — time to reach the 66% / 90% power thresholds.* 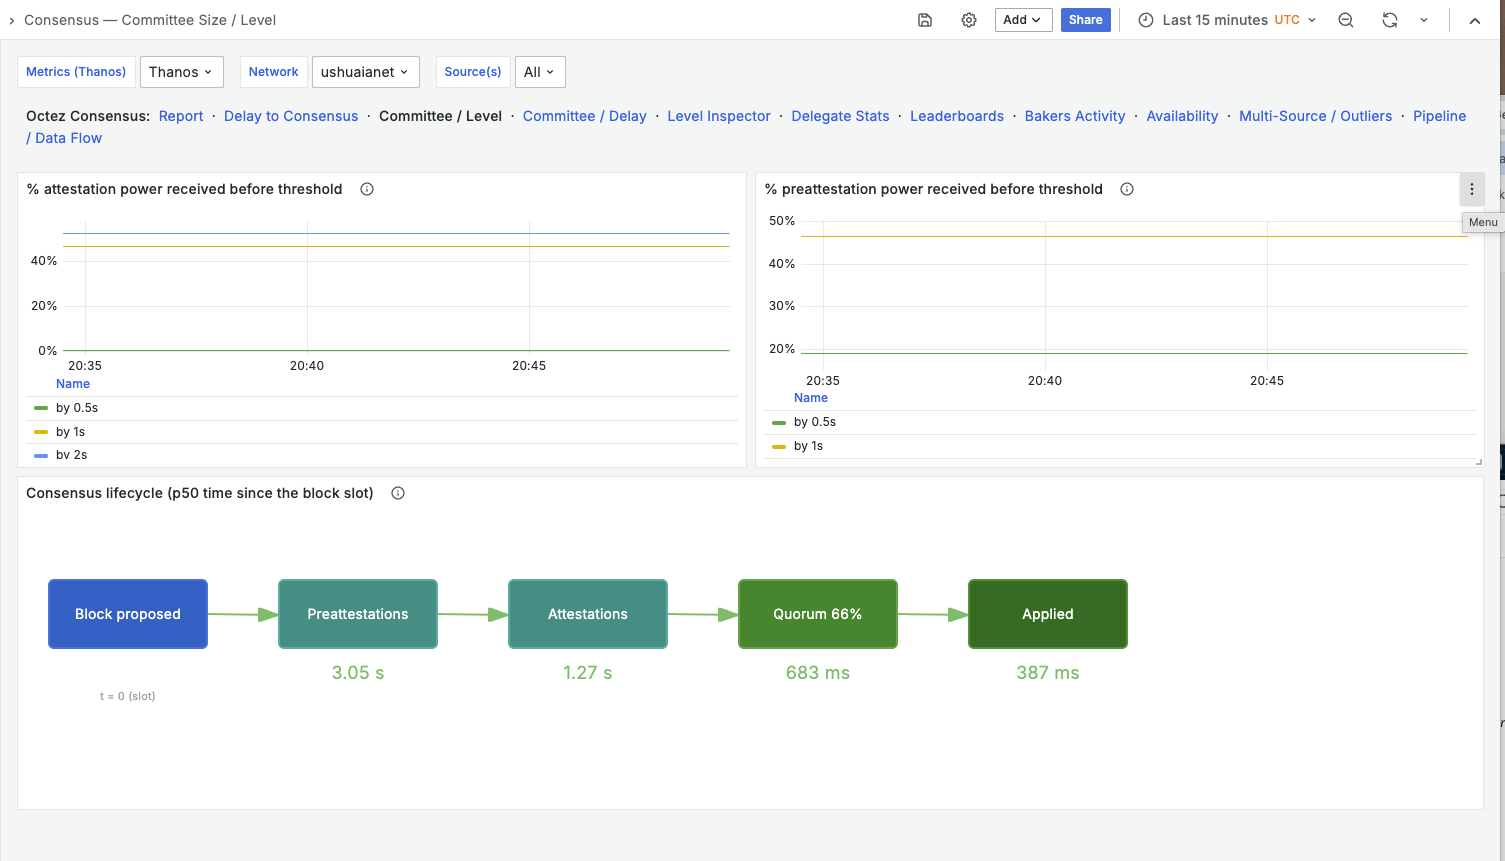 *Committee Size / Level — % of power received before a temporal threshold.* 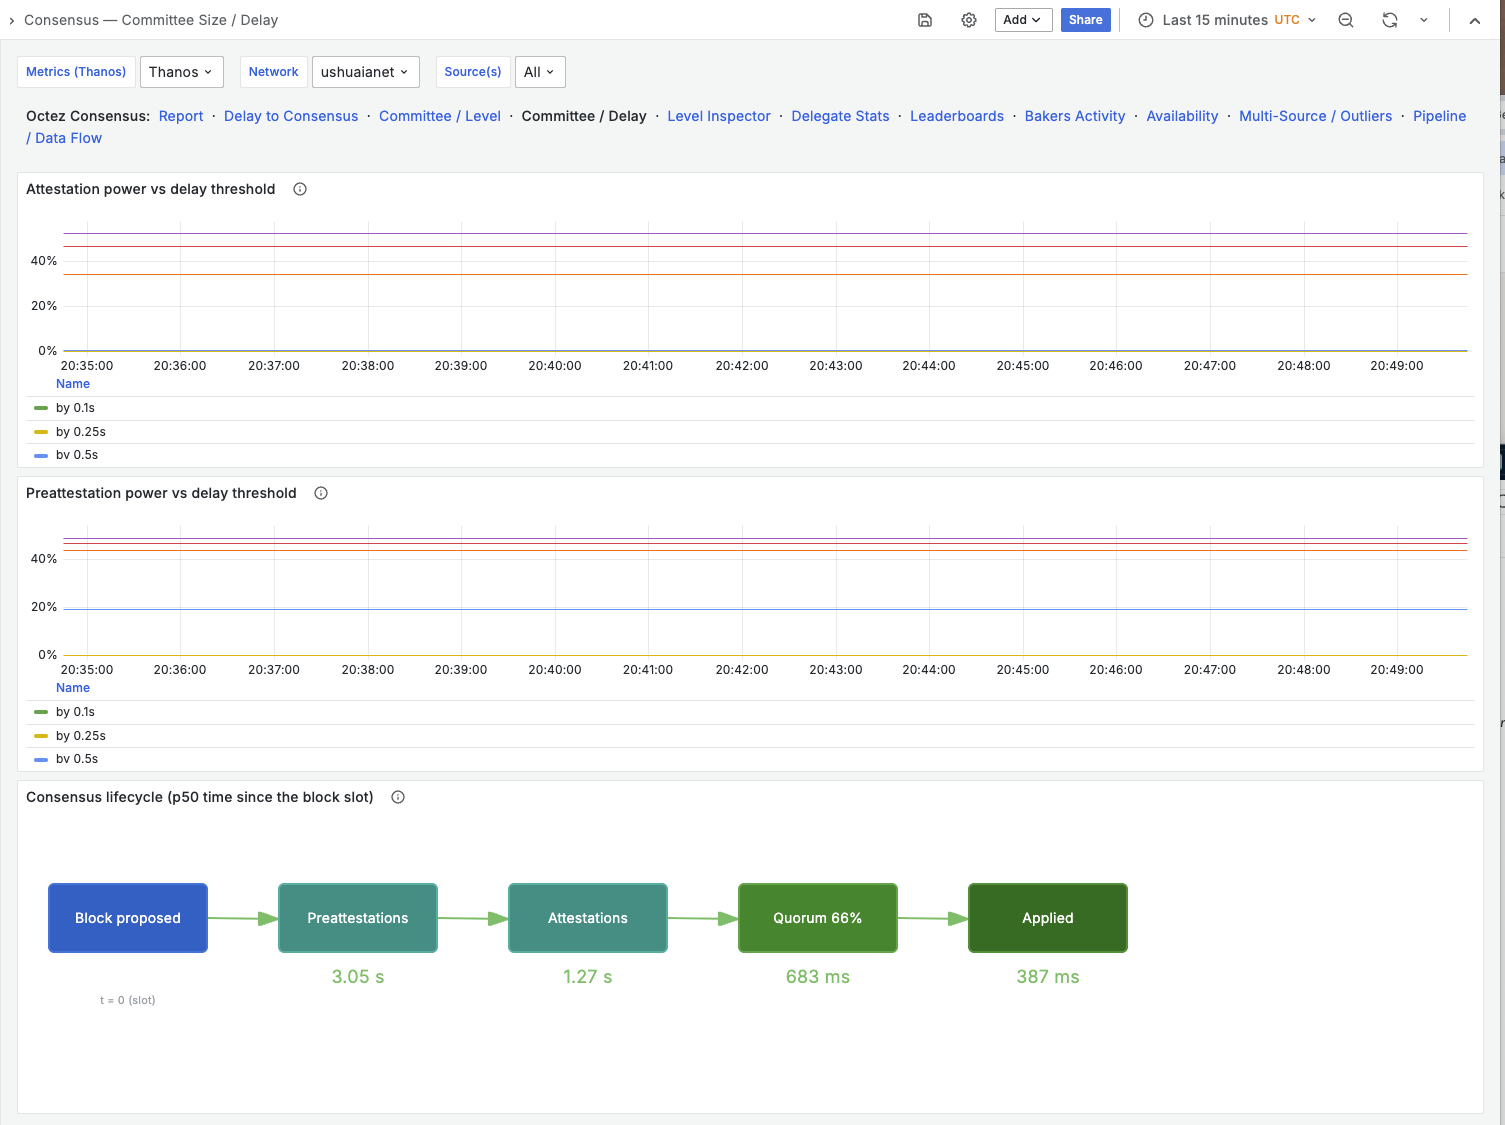 *Committee Size / Delay — power received as a function of the delay threshold.* 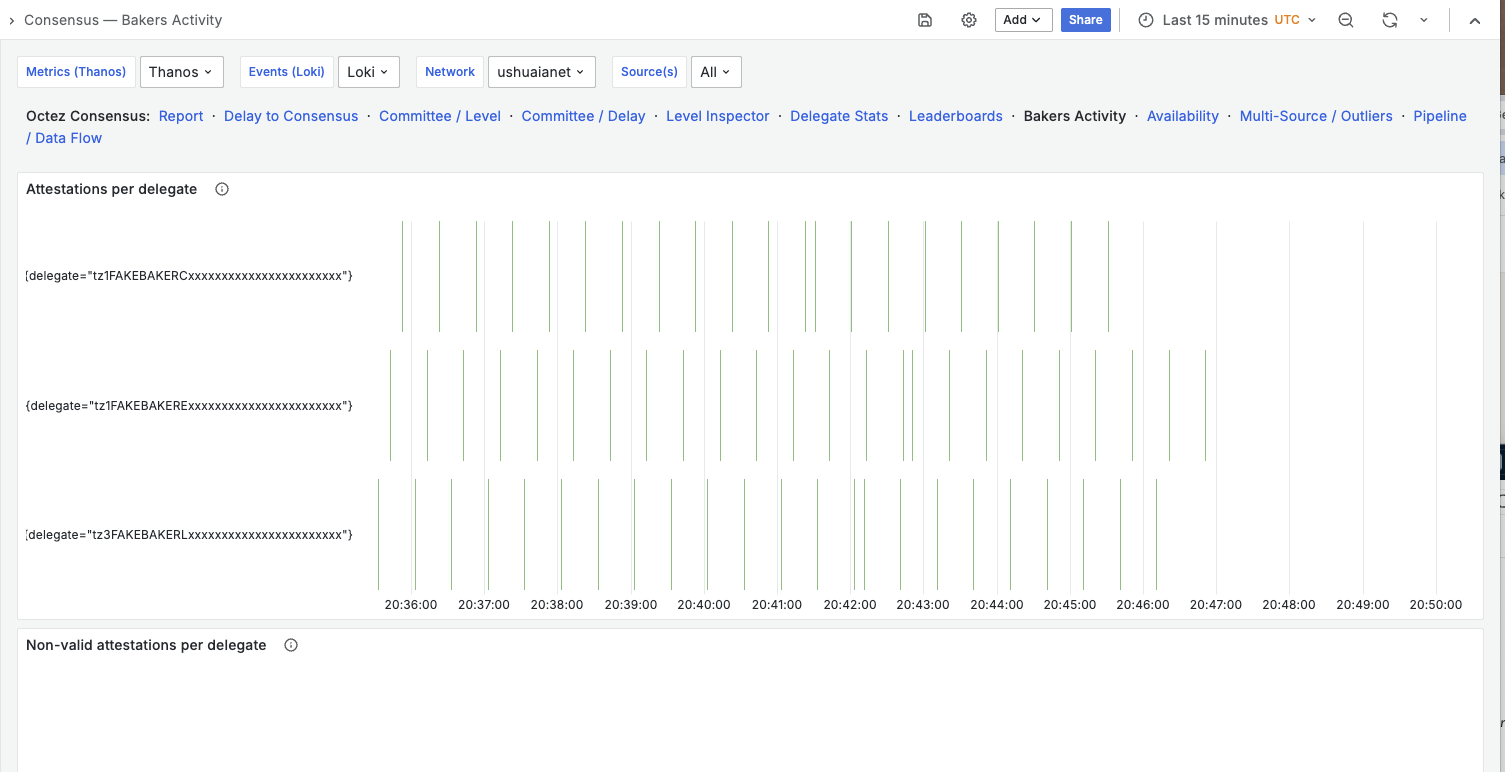 *Bakers Activity — per-delegate attested / non-valid timelines.* 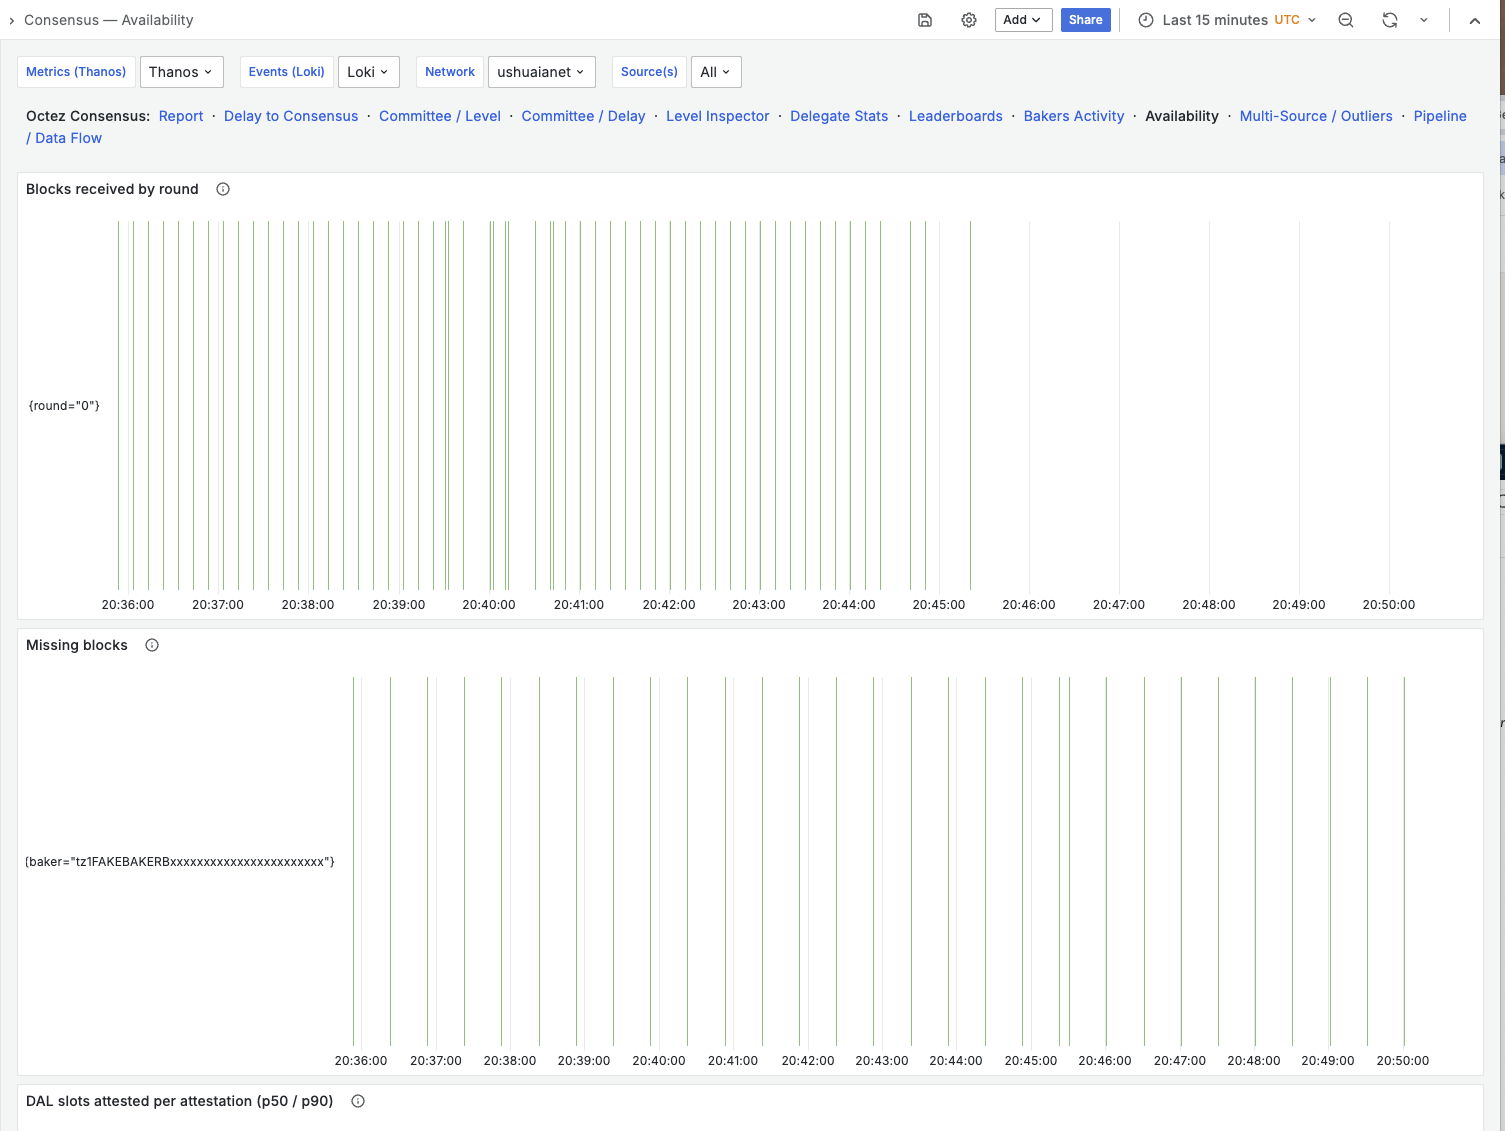 *Availability — blocks by round, missing blocks per baker, DAL slots attested.*The project is open source and self-contained. Issues and contributions are welcome: gitlab.com/tezos-infra/octez-consensus-exporter.
References
- Octez documentation — https://octez.tezos.com/docs/
- Tenderbake (Tezos consensus) — https://octez.tezos.com/docs/active/consensus.html
- Data Availability Layer (DAL) — https://docs.tezos.com/architecture/data-availability-layer
- Protocol Seoul (aggregate attestations) — https://octez.tezos.com/docs/protocols/023_seoul.html
- teztnets — https://teztnets.com/
data-encoding— https://gitlab.com/nomadic-labs/data-encoding- Prometheus / Thanos / Loki / Grafana — the CNCF observability stack
</content> </invoke>